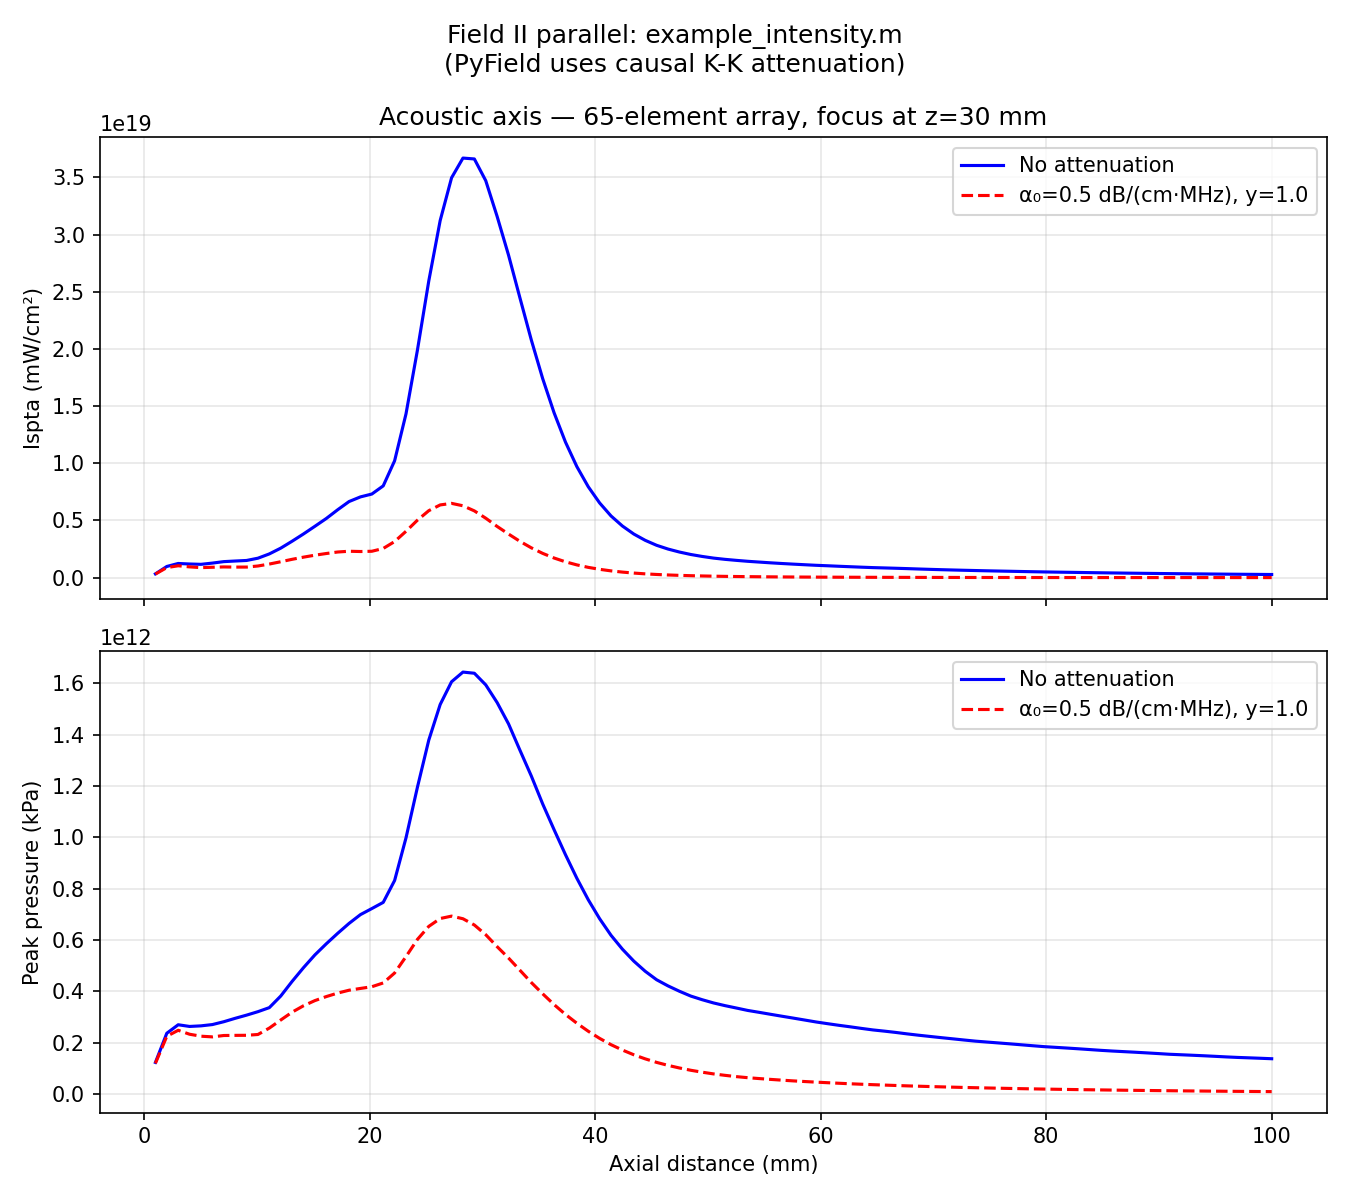
Example 10: Peak Pressure and Ispta Along the Acoustic Axis
On-axis peak pressure and spatial-peak temporal-average intensity (Ispta) versus depth for a focused linear array, with and without tissue attenuation — the quantities behind acoustic-output safety metrics (FDA/IEC).
Field II parallel: example_intensity.m. eSDIva uses causal power-law
attenuation with Kramers–Kronig dispersion instead of Field II's non-causal
linear-frequency approximation.
What you will learn
- Transient emission on an on-axis line grid
- Enabling attenuation with
Emission(alpha0=..., freq_power=...) - Computing peak pressure and Ispta from the pulsed field
Output
Run it
Key code
from esdiva.emission import Emission

sim = Emission(tx, fs=200e6, excitation=pulse, rho=1000.0,
               alpha0=0.5, freq_power=1.0)     # dB/(cm·MHz^y)
p, coords = sim(axial_line)                     # (Nt, 1, 1, Nz)

peak = np.abs(p[:, 0, 0, :]).max(axis=0)        # (Nz,) peak pressure
ispta = (p[:, 0, 0, :] ** 2).sum(axis=0) / (2 * Z_acoustic * fs * T_prf)