Phantom Simulation
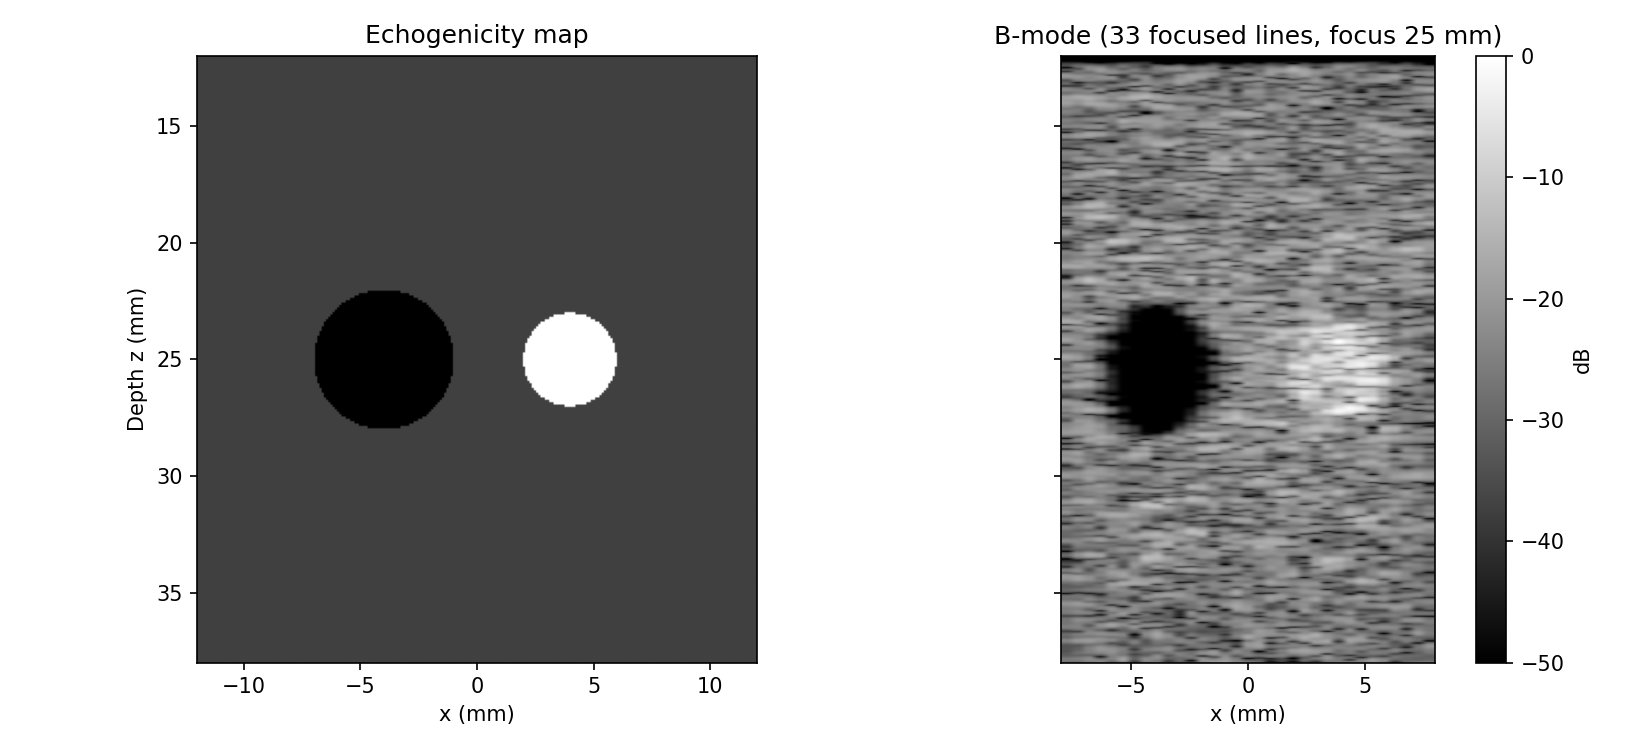
A phantom is a cloud of random scatterers whose amplitudes follow the echogenicity you want to image. Randomness is the point: it is the interference of many sub-resolution scatterers that produces speckle, and speckle is what a B-mode image is mostly made of. A regular lattice returns coherent echoes instead, which look like an image but obey none of the statistics that contrast and texture measurements assume.
from esdiva.utilities import make_phantom

pos, amp = make_phantom(extents_mm, n=20000, echogenicity_map=my_map)
rf, coords = sim.pulse_echo_rf(pos, amp)
make_phantom draws uniform random positions inside extents_mm and gives each
one an N(0, 1) amplitude scaled by echogenicity_map(r) — zero inside an
anechoic lesion, larger inside a bright one. The Gaussian draw is what makes the
envelope Rayleigh-distributed, as it is in tissue.
Use sequence_rf, even for one event
sequence_rf is the recommended entry point for any phantom study, static or
moving. The same RF is reachable by calling pulse_echo_rf once per transmit and
stacking the results — the physics is identical — but the loop gives you none of
the operational guarantees a multi-hour acquisition needs:
- Checkpointing. With
out_path=, each event lands on disk the moment it finishes, so a crash or a killed job costs at most the event in flight, and re-running resumes at the first missing one. A hand-rolled loop that dies in hour six has produced nothing. - A config fingerprint. The store records probe, medium, excitation, scatterers and events; re-running with any of them changed raises with a diff instead of silently mixing incompatible data into one dataset.
checkpoint_chunks=bounds the loss within one event, with zero-amplitude grid sentinels that pin one time grid per event so the partial RFs sum exactly.- Per-event time origins, collected into
coords["t0_per_event"]and consumed directly by the beamformers.
from esdiva.io import RFDataset

ds = RFDataset("rf_store")
ds.summary()                     # what is done, what is missing
rf, coords = ds.load_all()
ds.to_hdf5("channels.h5")        # UFF-compatible fields for MATLAB / USTB
pulse_echo_rf stays the right call for a single acquisition or a
PSF map; it accepts the same out_path= and routes through
sequence_rf internally, so it inherits the same guarantees.
Designing the phantom
- Speckle density — at least ~5–10 random scatterers per resolution cell
(λz/D)² · (pulse length)/2. Below that, the texture and every contrast number you compute from it are artefacts of the particular random draw rather than properties of the imaging system. Cell volume scales as ~λ³, so a 10 MHz probe needs roughly 50× more scatterers than a 3 MHz one for the same box. - Anechoic targets — radius ≥ ~3 PSF widths, or the lesion fills in from its own blurred edges and the contrast you measure is the blur, not the lesion.
- Wires — coherent within a resolution cell, so their brightness scales with PSF volume rather than with scatterer count. Keep them dim (~+10 dB over speckle), few, and far from any contrast target.
- Preview before burning hours —
sim.show(pos, amp)renders the cloud with the apertures, then run one event and check the envelope statistics (Rayleigh gives mean/std ≈ 1.91) before launching the full sequence.
Size the run on the machine that will run it
from esdiva.utilities import estimate_sequence_runtime
est = estimate_sequence_runtime(sim, pos, n_emissions=n_angles * n_frames)
Cost is dominated by scatterers × emissions, but the constant is a property of the hardware — cores, memory bandwidth, threading — and varies by more than an order of magnitude between a laptop and a compute node. It is not even stable on one machine: the same computation has measured 31 s and 42 s per emission minutes apart under different background load.
Beamforming the result
from esdiva.beamforming import das_volume, envelope_db

vol, gc = das_volume(rf, coords, events, rx, grid_mm, c=1540, fnum=1.0)
img = envelope_db(vol)
A few things that decide whether the numbers are honest:
- Rect receive apodization. Elements roughly λ wide already taper the aperture through their own directivity; adding a Hann receive taper on top halves the effective aperture (measured 0.98 vs 0.52 mm FWHM). Prefer a rect taper and a low f-number.
- TGC from speckle-only regions, applied depth-only, never estimated across an anechoic target.
- Report plain DAS. Coherence-factor weighting recovers contrast numbers but destroys speckle texture and passes coherent clutter — quote it as a ceiling, not as the result.
- ~30 dB display window. After TGC, speckle fills about 30 dB; a 40+ dB window makes perfectly normal sidelobes look like artefacts.
Worked examples
| Figure | Study |
|---|---|
 |
Speckle phantom |
 |
Full Matrix Capture |
Full signature: API → Reception · API → Beamforming.